# Core Web Vitals Issues Hurting Your Rankings
> LCP, CLS, INP definitions, common causes per metric, theme/plugin culprits in WordPress, image optimisation, JS blocking, lab vs real-user data.
URL: https://www.adam-seo.com/guide/core-web-vitals-issues/
Last-Modified: 2026-05-08
We know that search engine rankings alone are meaningless without tangible business results. This principle has guided our agency, Adam SEO, since Adam Yong founded it in 2011.
Our team sees poor site speed acting as a direct threat to online revenue every single day.
The most common core web vitals issues hurting your rankings usually stem from outdated code or heavy plugins. We want to help you stop losing potential customers before your page even finishes loading. Let us break down the specific metrics Google measures and outline the exact steps required to fix them.
## What Core Web Vitals actually measures
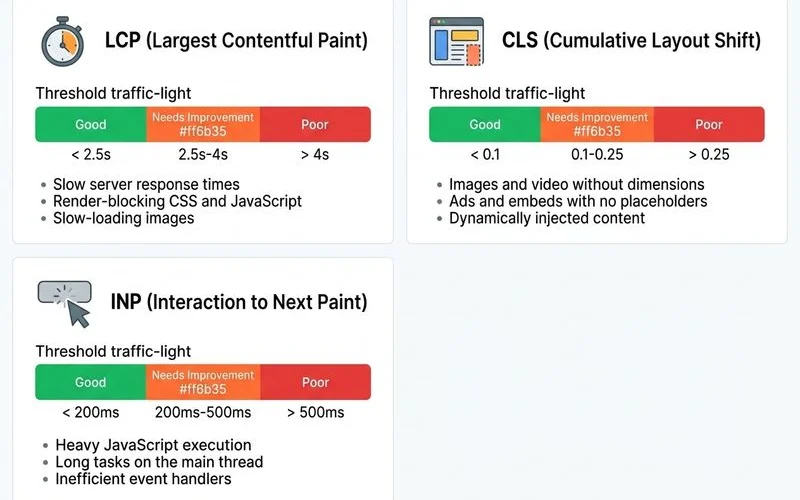
We often find that site owners misinterpret these technical scores. The Core Web Vitals represent three distinct metrics, and Google applies strict thresholds to classify each as Good, Needs Improvement, or Poor.
Our analysis of the 2025 Web Almanac data shows that only about 48 percent of mobile pages pass all three vitals globally. You have a clear competitive advantage if you can optimise these specific areas.
| Metric |
Good |
Needs Improvement |
Poor |
| LCP (Loading) |
Under 2.5s |
2.5s to 4.0s |
Over 4.0s |
| CLS (Stability) |
Under 0.1 |
0.1 to 0.25 |
Over 0.25 |
| INP (Responsiveness) |
Under 200ms |
200ms to 500ms |
Over 500ms |
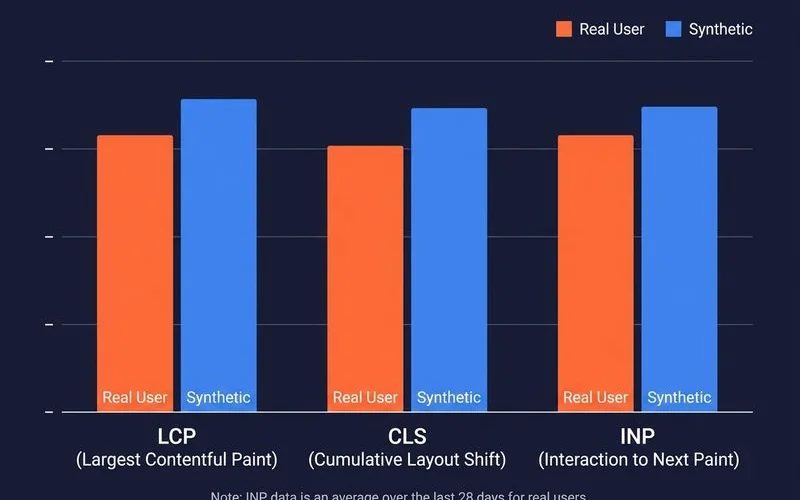
We track these metrics using real user data from the Chrome User Experience Report (CrUX). The system uses a 28-day rolling window per origin and per template type to calculate your final score.
## LCP: the speed-to-meaningful-content metric
Our team prioritises LCP because it is the most visible speed marker for your visitors. LCP (Largest Contentful Paint) tracks how quickly the largest visible content element renders on the screen.
We reviewed a 2026 Deloitte study showing that every 100-millisecond delay in LCP cuts conversion rates by up to 7 percent. Fixing this metric directly protects your bottom line.
Our developers regularly see the following common causes for LCP failures:
- **Slow server response**: A Time to First Byte (TTFB) over 800ms indicates a hosting, server configuration, or backend bottleneck.
- **Render-blocking resources**: CSS or JavaScript in the head of your document delays rendering. You can fix this by inlining critical CSS and deferring non-critical scripts.
- **Large hero images**: Using unoptimised image formats like standard JPGs instead of WebP or AVIF causes massive delays. The hero image is usually the LCP element, so you must implement proper dimensions and avoid lazy-loading above the fold.
- **Late-loading web fonts**: Custom fonts often block text rendering until they fully download. A quick solution is using `font-display: swap` and preloading your most critical fonts.
- **Heavy JavaScript framework hydration**: React or Vue applications frequently delay rendering until all scripts execute. Server-side rendering (SSR) or static generation solves this bottleneck.
For Malaysian SME stores on shared hosting, server response is often the first lever you can pull. We consistently drop TTFB by migrating clients to managed Shopify or quality regional hosting.
Local hosting providers like Exabytes in Kuala Lumpur, or Singapore-based Google Cloud nodes through Kinsta, routinely cut LCP by 30 to 50 percent.
## CLS: the layout-stability metric
We know that unexpected page jumps ruin the shopping experience. CLS (Cumulative Layout Shift) measures how much the layout shifts unexpectedly during the page load process.
Our specialists consider this the easiest core web vital to fix because most causes are layout discipline issues rather than complex infrastructure problems. You can usually resolve these shifts with a few straightforward CSS adjustments.
We frequently uncover these common causes of CLS failures during our technical audits:
- **Images without dimensions**: Browsers reserve no space if you leave out the size, and the content shifts violently when the image finally loads. Always specify `width` and `height` attributes.
- **Web fonts swapping**: The fallback font and your custom web font often have different sizes. The layout shifts when the final web font loads, but you can prevent this using `font-size-adjust` to match the fallback font size.
- **Dynamically injected content**: Ads, third-party embeds, and cookie consent banners inserted after the initial render push content down. You must reserve space with fixed placeholder containers.
- **Carousels and sliders**: Auto-advancing sliders cause immediate layout shifts on load if not coded with strict height containers.
A quick fix for dynamic ad injections is reserving space with fixed placeholder containers before the page fully renders.
## INP: the interaction-responsiveness metric
We consider INP the most challenging metric to optimise because it requires structural code changes. INP (Interaction to Next Paint) officially replaced First Input Delay (FID) in March 2024 as the primary user-input responsiveness metric.
Our monitoring tools show this vital measuring the delay between a user tapping a button and the browser actually painting the visual change. A score under 200 milliseconds is good, while anything over 500 milliseconds is poor and actively hurts your rankings.
We trace most INP failures back to these specific JavaScript issues:
- **Heavy JavaScript handlers**: Complex logic attached to simple input events freezes the browser.
- **Third-party scripts**: Analytics tools like Hotjar or Google Tag Manager often hijack the main thread and block user actions.
- **Large React or Vue components**: Frameworks that force massive re-renders on every minor state change create noticeable input lag.
- **Expensive style recalculations**: CSS changes triggered by interactions force the browser to redraw the entire page layout.
You typically can't fix INP with simple caching plugins. Our developers usually rebuild the JavaScript architecture, using commands like `setTimeout` to break up long tasks, rather than relying on basic configuration tweaks.
## WordPress and Shopify-specific culprits
We constantly audit both platforms and see identical patterns causing core web vitals issues. Each platform has its own unique ecosystem traps that drag down performance.
Our advice is to look beyond general server upgrades and address this platform-specific bloat.
### WordPress (WooCommerce) Bottlenecks
Our WordPress clients usually suffer from a combination of visual bloat and heavy database queries. The most common culprits include:
- **Heavy themes**: Commercial themes bundled with multiple slider plugins create massive JavaScript payloads.
- **Plugin bloat**: Running 30 or more active plugins means each one is independently adding unoptimised scripts and styles to your header.
- **Page builders**: Tools like Elementor or Divi generate an incredibly heavy DOM structure that modern browsers struggle to parse quickly.
- **Unoptimised media**: Missing modern formats like WebP and failing to implement proper lazy-loading by default cripples your LCP score.
We often deploy lightweight caching solutions like LiteSpeed Cache or WP Rocket to mitigate these heavy DOM structures.
### Shopify Performance Traps
We find that Shopify merchants face different challenges, mostly related to external scripts. These common issues block the main thread:
- **Intrusive apps**: Review widgets like Loox or live chat tools inject heavy JavaScript on every single page.
- **Unoptimised theme code**: Custom themes often feature deeply nested Liquid template inheritance, which slows down the initial server response.
- **Hero video backgrounds**: Massive auto-playing videos on collection pages instantly destroy mobile LCP scores.
- **Custom font stacks**: Typography loaded from third-party servers late in the rendering sequence causes both LCP and CLS failures.
Our standard procedure is to audit third-party apps and defer non-critical JavaScript to keep the main thread clear.
## Fixing CWV systematically
We approach performance recovery through a strict, data-driven sequence. You can't guess your way to a passing score.
Our standard order of operations ensures you tackle the most impactful problems first:
1. **Field data baseline**: Check the CrUX dashboard for your top 20 traffic templates.
2. **Identify the worst metric**: Pinpoint whether LCP, CLS, or INP is failing the hardest per template.
3. **Per-metric fix priority**: Start with visual loading speed, as LCP usually moves the fastest and shows immediate conversion gains.
4. **Ship fixes in staging**: Validate your code changes with Lighthouse lab data, and then deploy to production.
5. **Wait 30+ days**: The Chrome dataset uses a 28-day rolling window, so you must wait for CrUX to reflect your changes.
6. **Re-measure**: Check the live data and iterate on your next-priority issues.
We handle this entire process from audit to execution through our Technical SEO services. Context is always important for these broad checks, so review What does a Technical SEO audit cover to plan your next steps. Our team also explains proper sequencing clearly in Technical SEO vs On-Page SEO.